새로운 해저지도 과학자들은 새로운 기능을 찾을 수 있도록 도와줍니다
페이지 정보
작성자 허순호쪽지보내기
메일보내기
자기소개
아이디로 검색
전체게시물
댓글 0건
조회 508회
작성일 16-01-14 20:12
본문
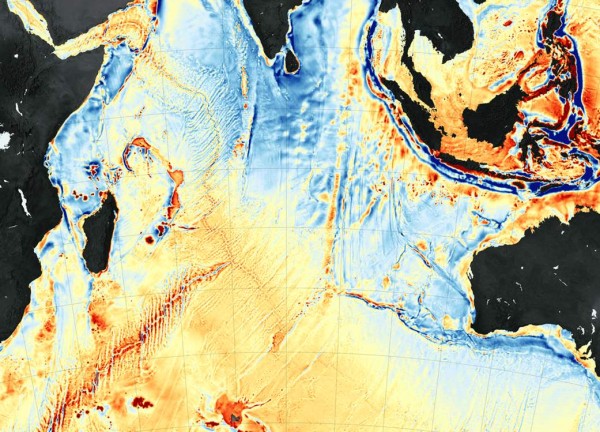
강한 중력의 영역이 강조 표시와 서부 인도양의 해저지도
국제 과학 팀 최근 출판 지구의 중력장에 기초 해저의 새로운 맵을 , 그리고 특히 유용한 도구이다. 이러한 해저지도는 특히 이전에 미지의 영역에서, 네비게이션과 승무원 동무 및 선박의 선장 도움이 될 수 있습니다. 그들은 석유, 가스 및 광물 자원에 대한 정찰 탐광에 도움이됩니다. 그리고지도는 구글 어스를 통해 스크롤 할 때 당신이 볼 수있는 해저의 약 80 %를 포함한다.
해양학의 스크립스 연구소의 데이비드 샌드 웰, 국립 해양의 월터 스미스와 대기 관리, 동료 조립으로지도 위, 서쪽 인도양 해저 중력 이상을 보여줍니다. 오렌지와 레드의 그늘은, 주로 수중 능선, 해산, 그리고 지구의 지각 판의 가장자리의 위치와 일치하는 현상을 해저 중력이 세계 평균보다 (milligals에) 강한 지역을 나타냅니다. 파란색의 어두운 그늘은 바다에서 가장 깊은 골짜기와 참호에 해당하는, 가장 낮은 중력 지역을 나타냅니다.
지도는 1980 년대와 90 년대에 비행 임무에서 컴퓨터 분석 및 유럽 우주국의 CryoSat-2에서와 NASA-CNES 제이슨-1의 새로운 위성 데이터뿐만 아니라, 오래된 데이터의 모델링을 통해 만들어졌습니다. 샌드 웰와 그의 팀은 해저와 해수면의 높이의 고도계 측정에서의 중력장의 모양을 유도; 산 및 기타 해저 기능은 질량을 많이 가지고, 그래서 그들은 대량의 자신의 중심을 향해 더 많은 물을 끌어 위의 물에 중력을 발휘. 새로운지도는 5km (3 마일)로 좁은 해저 기능을 묘사한다.
더보기 : 항공 우주국 (NASA) 지구 관측소
원본
Seafloor map of western Indian Ocean with areas of stronger gravity highlighted
An international scientific team recently published a new map of the ocean floor based on Earth’s gravity field, and it is a particularly useful tool. Such seafloor maps can aid submariners and ship captains with navigation, particularly in previously uncharted areas. They are helpful to prospectors scouting for oil, gas, and mineral resources. And the maps comprise nearly 80 percent of the seafloor that you see when you scroll through Google Earth.
The map above shows seafloor gravity anomalies in the western Indian Ocean, as assembled by David Sandwell of the Scripps Institution of Oceanography, Walter Smith of the National Oceanic and Atmospheric Administration, and colleagues. Shades of orange and red represent areas where seafloor gravity is stronger (in milligals) than the global average, a phenomenon that mostly coincides with the location of underwater ridges, seamounts, and the edges of Earth’s tectonic plates. The darkest shades of blue represent areas with the lowest gravity, corresponding to the deepest troughs and trenches in the ocean.
The maps were created through computer analysis and modeling of new satellite data from the European Space Agency’s CryoSat-2 and from the NASA-CNES Jason-1, as well as older data from missions flown in the 1980s and 90s. Sandwell and his team derived the shape of the seafloor and its gravity field from altimetry measurements of the height of the sea surface; mountains and other seafloor features have a lot of mass, so they exert a gravitational pull on the water above pulling more water toward their center of mass. The new map portrays seafloor features as narrow as 5 kilometers (3 miles).
More: NASA Earth Observatory
http://www.nasa.gov/image-feature/new-seafloor-map-helps-scientists-find-new-features
추천10 비추천0
댓글목록
등록된 댓글이 없습니다.
